KPIs and metrics and spreadsheets, oh my! Event data can seem scary. So use these handy tips to help pave your yellow-brick-road to a better event.
It’s the age where “big data” has moved from a buzzword to daily reality. Yet, 55% of event professionals still believe that they don’t measure their event data well enough. And only 10% say they measure their event success in great detail.
All of this untapped information presents an opportunity for anyone willing to search for stories in the numbers. Event data can do so much more than simply measure event success: it can help you proactively manage and improve your conference for the coming years.
However, before you dive headfirst into reports and spreadsheets, you need to define exactly what event data you want to collect and analyse. Don’t fall into the trap of gathering an overwhelming number of metrics. You want to make sure that everything you monitor provides actionable insight. So align your data strategy with your overall goals for the event. And constantly question the validity of your data.
Finally, ensure that any processes you use to gather information are compliant with data and privacy standards in your region (like the GDPR in the EU). If you’re planning on using conference management software, double-check that it complies with these regulations as well.
So, with all this in mind, here are 7 ways you can start using event data to improve your conference…
1. Advertise your event using an attendee profile
It’s now common for conferences and trade shows to include attendance statistics in their exhibitor prospectus. This helps increase business interest in buying a spot on the show floor.
You can delve into registration data to help create your own prospectus. Look for key delegate metrics like: firmographics, demographics, reasons for attending, interests, and purchasing influence or role. And if you collect information about high-traffic areas on your show floor, you can use these hotspots to sell the most popular locations at a premium price for your next event.
Information on past attendance can appeal to more than just the exhibitors too. If you’ve already put in the effort to analyse your registration data, why not use it to attract more attendees? Potential delegates may be struggling with conference fees and their own perceived return on investment (ROI) from attending. If you frame it correctly, you can use registration data to promote the top-notch networking opportunity that your event provides.

Ex Ordo offers a ready-made export of attendee details.
2. On that note… Analyse your conference attendance trends
Event attendance is a common event metric. This information is important, but high attendance doesn’t always equal success. Do your attendees enjoy the event? Who are your return attendees and why do they return? How many new attendees do you have each year and why do they come?
Data can be an early sign that it’s time to spice up your event. A decline in attendance of long-time attendees or lower sponsor/exhibitor numbers are both indicators of a potential issue with your event. If this is the case, you may need to come up with some innovative event ideas to capture the interest of your delegates. And if new attendees are low, it could mean your marketing and outreach campaigns aren’t quite hitting home.
Depending on your event goals, you’ll likely need to monitor attendee statistics in more detail. Perhaps you’re looking to attract more Asian researchers to your international conference but registration numbers are low in this region. Could you implement strategies to better attract them? Access issues can prevent a diverse scope of delegates from attending your conference. If the event data indicates a lack of diversity, it may be a sign that you need to improve your conference accessibility.
3. Optimise your submission and review process
There’s been a bit of a buzz around making the peer review process more effective. Event data can help you manage your process and improve it each year. If you know how long each stage usually takes, you can work this into your planning schedule and create deadlines for reviewers that won’t leave you scrambling to pull things together at the last minute.
Consider using an abstract management system like Ex Ordo so you can do even more with your data. Ready-made reports allow you to pull information on reviewers (including individual scores, average scores, and areas of expertise). Does one reviewer score much lower overall than any others? It might be worth double-checking their assigned abstracts to ensure you haven’t counted out a high-potential entry simply because of one harsh critic. If you’re worried about bias affecting your review process, you can carry out double-blind review and prevent nepotism based on affiliations.
If you notice a high rejection rate from reviewers, it could signal the need to reassess the quality of submissions. Who are the contributors? Where are they from? Are the topics aligning with your conference’s focus? You might need to refine your call-for-papers approach. By analysing submission data, you can identify the sources of your most relevant and high-quality abstracts. Additionally, you may uncover unanticipated interest in certain topics. For instance, if one subject received twice the anticipated submissions, reviewers with expertise in that area may have been overwhelmed. Consider assigning more reviewers to that topic in future events.

4. Identify your event registration trends
Once you’ve sorted out your submissions and preliminary schedule, it’s time to sell tickets and boost one of your most important event success metrics: revenue from registration. Cash is king, and you can’t continue to run a great event if you’re losing money year after year. So how can you use registration data to improve your conference planning process?
To start, registration data can help you identify the best pricing strategy for your conference. By charting weekly registrations against event milestones, you can spot patterns and their likely causes.
There’s a saying that goes “Data is the closest thing we have to predicting the future. Without it, we’re just guessing.” Event data from previous years can show you how certain pricing strategies (like early bird rates or discount codes) performed in the past. This knowledge can help you make predictions about what will happen if you shake up your price or use outside-the-box strategies like increasing your conference fees by one euro a day.
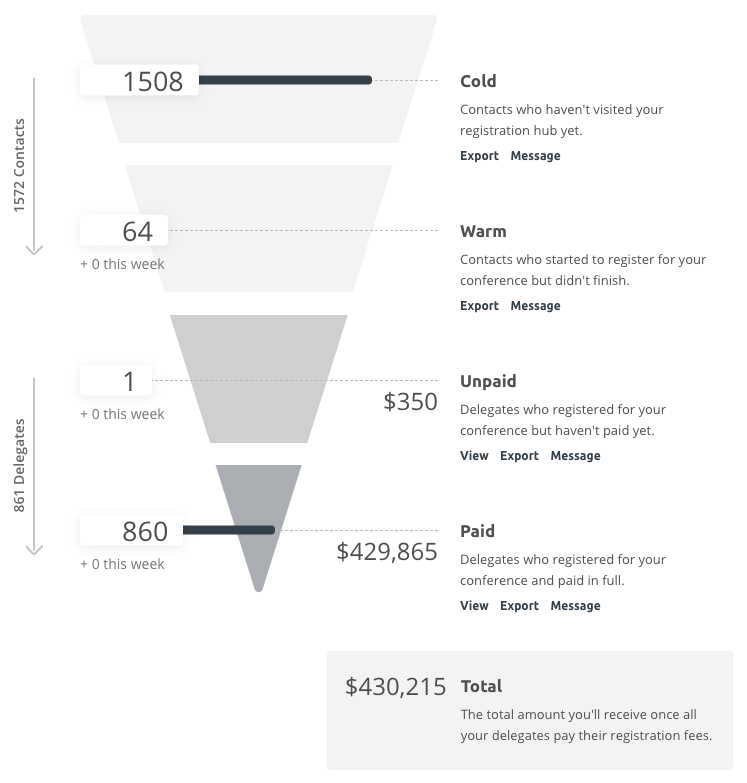
Seeing registration and payment details can also highlight potential opportunities or areas of concern. You can target “warm” leads in your registration funnel who may have stopped halfway through registering by offering a discount code to encourage them to finalise their ticket. Or if you have an integrated system that provides both scheduling and registration, you can use your event data to spot which session presenters have yet to pay. You may want to reach out and confirm their attendance in advance to avoid the panic of having a last-minute no-show.

An example of cold and warm leads in Ex Ordo’s registration funnel.
All in, understanding registration trends help you plan for the day by giving an early indication of expected attendance. Data on fees paid can assist you in budgeting based on the flow of incoming payments. And spikes in registration at specific times can indicate which promotional methods brought you the most bang for your buck.
5. Use event data to improve sessions at your conference
While networking opportunities are one of the main draws for delegates, the sessions, speakers, and social events offered at your conference all play a role.
Use your mobile app to collect a wealth of data on the sessions that are most popular. Which sessions had the highest attendance? Which caused the most buzz on social media (or your app)?
Of your social events, which had the highest registration numbers? Is there one that continuously sells out? Consider moving it to a bigger venue to maximise your registration income from that event. Alternatively, check which events and sessions had the lowest engagement. Find ways to improve them, or consider dropping them to make room for something more in-demand.
You can use these ready-made reports to your advantage and supplement them by collecting information from delegates using an engaging survey tool or a mobile app.
And if you’re interested in gathering real-time event data, crowdshaping and measuring “emotional data” through facial scans are two options. These allow you to measure and manage the success of your event offerings while delegates are experiencing them.
6. Monitor your mobile app activity
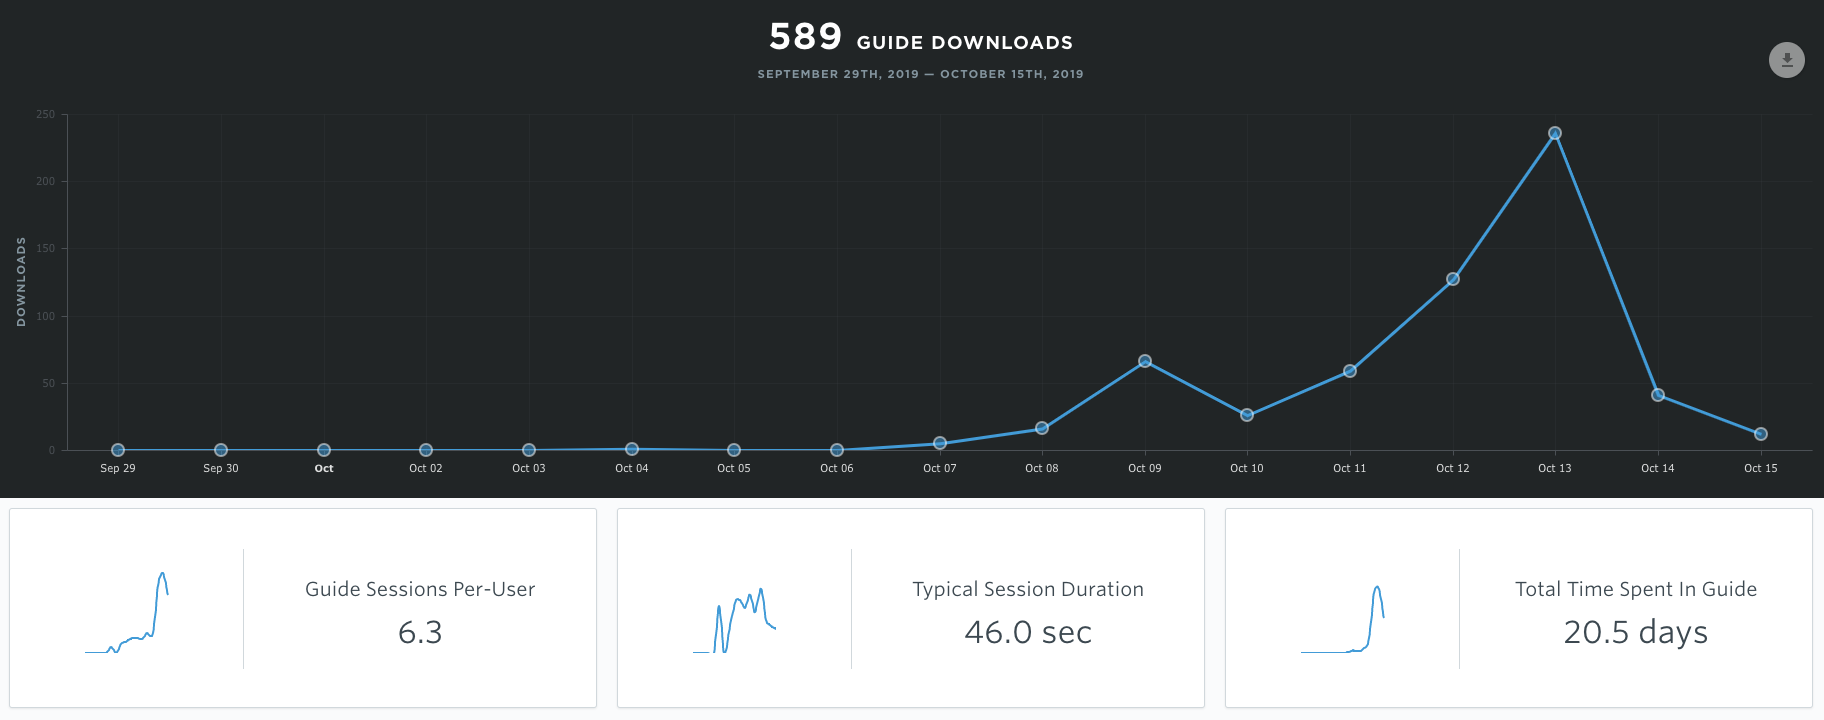
If you use a mobile conference app, you can include polls during and after the conference to collect insight directly from your delegates. Some apps will let you export the analytics data directly from your dashboard. You may want to look for the most popular app features to improve your app for the coming years. Adoption rates, download dates, and usage time can show you the level of engagement to help you decide if you need to more heavily promote your app next year. Finally, seeing the top-viewed sessions in your app can help you determine what was most popular.

App downloads by day and a few other important engagement metrics on Ex Ordo Mobile.
Planning to include a post-event survey in your app but aren’t sure what to include? Consider measuring your net promoter score (NPS). You can do this by asking your delegates one simple question: “On a scale of 1-10, how likely would you be to recommend this event to a friend or colleague?” Anyone who responds with a 9 or 10 is an advocate of your event and could be helpful in spreading word-of-mouth. Wootric is a handy system that helps you measure NPS and other customer experience metrics in order to grow your community of volunteer promoters. There are others that can help measure a good NPS score.
7. Evaluate your real event ROI
There is no golden list of key metrics for event management. 91% of planners measure the success of their events on attendee satisfaction, 61% measure according to specific event objectives and 60% determine results based on staying within budget. A smaller 37% report that social media exposure is a key metric of event success. Each event is unique and it’s important to consider the purpose of your conference before you select the metrics that will best reflect success for you.
Cost-per-attendee can offer a good starting point to calculate your financial ROI. However, real ROI varies according to your goal. Some events aim to increase income, while others aim to increase discussion around a specific topic or increase membership interest in your organisation. Compare your desired outcomes with the event costs.
When your committee is making plans for upcoming conferences, encourage them to think about the numbers in addition to their creative opinions. New strategies should be backed by event data stories from analysis of previous years. Or, if they suggest an addition that wasn’t inspired by data, ask them to think about which key performance indicators (KPIs) will best measure the success of their new strategy. Do they expect the addition to increase revenue? Increase sponsorship interest? Increase your NPS? Perhaps they want to implement strategies that will decrease waste and make your conference more sustainable. How will you measure this?
These questions will help you compare your expected ROI against the actual outcome of your event.
Harnessing the power of a conference management system
Now that you’re sorted with a host of ways to create actionable insights from event data, it’s time to consider how you’ll collect and manage that data. A conference management system can offer you a built-in way to export data on submissions, reviews, programme, registration, and your mobile app. Integration across all these features allows you to better understand your attendees and your entire planning process. All of which helps when you’re looking for ways to improve your conference for everyone involved.
If you’re interested in finding out more about what conference software can do for you, take a look at our demo video.

Or if you’re simply looking for a more detailed list of metrics, their definitions, and how to calculate them, check out this post on measuring event success.
In Conclusion
In conclusion, leveraging event data can significantly enhance the quality and effectiveness of your conference. From refining your call-for-papers strategy to optimising your reviewer assignments, data-driven insights offer a clear path to improving the attendee experience and overall event success. By analysing submission trends, you can better understand the topics that resonate with your audience and ensure that the right expertise is in place for the review process. This not only helps balance reviewer workloads but also ensures that the best submissions make it through, ultimately enriching your conference content.
